 CYNDRA
A quarter of AI agents may already be running unmonitored in production, according to security analysis of shadow and orphaned agents. That makes AI agents observability less like a developer convenience and more like an accountability control. If an autonomous system can choose tools, retry requests, delegate work, or change records, a final response log can't tell you what really happened.
Production observability has to answer four questions for every run: what the agent saw, what it decided, what it changed, and under whose authority it acted. Tracing model calls is necessary, but it isn't sufficient. The difficult incidents usually occur between reasoning steps, inside retries, tool arguments, permission boundaries, and external writes.
Table of Contents
- Why AI Agent Observability Is Now Critical Infrastructure
- The Architecture of Distributed Traces for Agents
- Implementing OpenTelemetry for Agent Telemetry
- Production Metrics That Define Agent Health
- Dashboard Design and Alerting Thresholds
- Monitoring Side Effects and Tool Interactions
- Security Gaps and Shadow Agent Visibility
- Runbook Snippets for Agent Incident Response
Why AI Agent Observability Is Now Critical Infrastructure
The global AI observability market was valued at USD 1.2 billion in 2024 and is projected to reach USD 8.7 billion by 2033, implying a 24.6% CAGR over that period, according to NextMSC's AI observability market estimate. A separate estimate places the market at USD 3.86 billion in 2026 and projects USD 44.20 billion by 2035, using a different market definition and forecast period. The disagreement between estimates matters less than the direction. Enterprises are spending on the ability to inspect, evaluate, and govern AI systems after deployment.
Agents create a harder operational problem than single model calls. One user request can produce a planner decision, several model calls, retrieval operations, tool invocations, retries, and handoffs to other agents. Each step can introduce latency, cost, incorrect context, or an unsafe action while the final answer still looks plausible.
That changes the definition of reliability. A team can't prove that an agent is safe by sampling its final text. It needs evidence of the complete execution path, including token usage, tool-call frequency, error rates, evaluation scores, and state changes. It also needs attribution by user, workflow, tenant, and agent identity so an anomalous action can be investigated rather than merely observed.
Observability is evidence, not decoration
A useful production layer supports three audiences at once:
- Engineers need span-level evidence to locate a failed call, bad retrieval result, or retry loop.
- Operations teams need aggregated dashboards for latency, cost, throughput, and failure patterns.
- Security and compliance teams need an auditable record of decisions, permissions, tool arguments, approvals, and external changes.
Simple logs serve the first audience poorly once execution becomes distributed. They often preserve events without preserving their causal relationship. A trace can show that a model call preceded a tool write, that the write returned an error, and that the agent retried it under the same user request.
For teams familiar with web and mobile systems, Capgo's observability guide for Capacitor apps offers a useful comparison. Agent systems need the same basic discipline of correlating events across a request, but they must add model-specific data and decision context.
Practical rule: If an agent can change a system of record, observability belongs in the production architecture review, not in the backlog of developer experience improvements.
The Architecture of Distributed Traces for Agents
A log tells you that something happened. A distributed trace shows how one event caused another. For an agent, that distinction is the difference between reading symptoms and reconstructing the decision path.
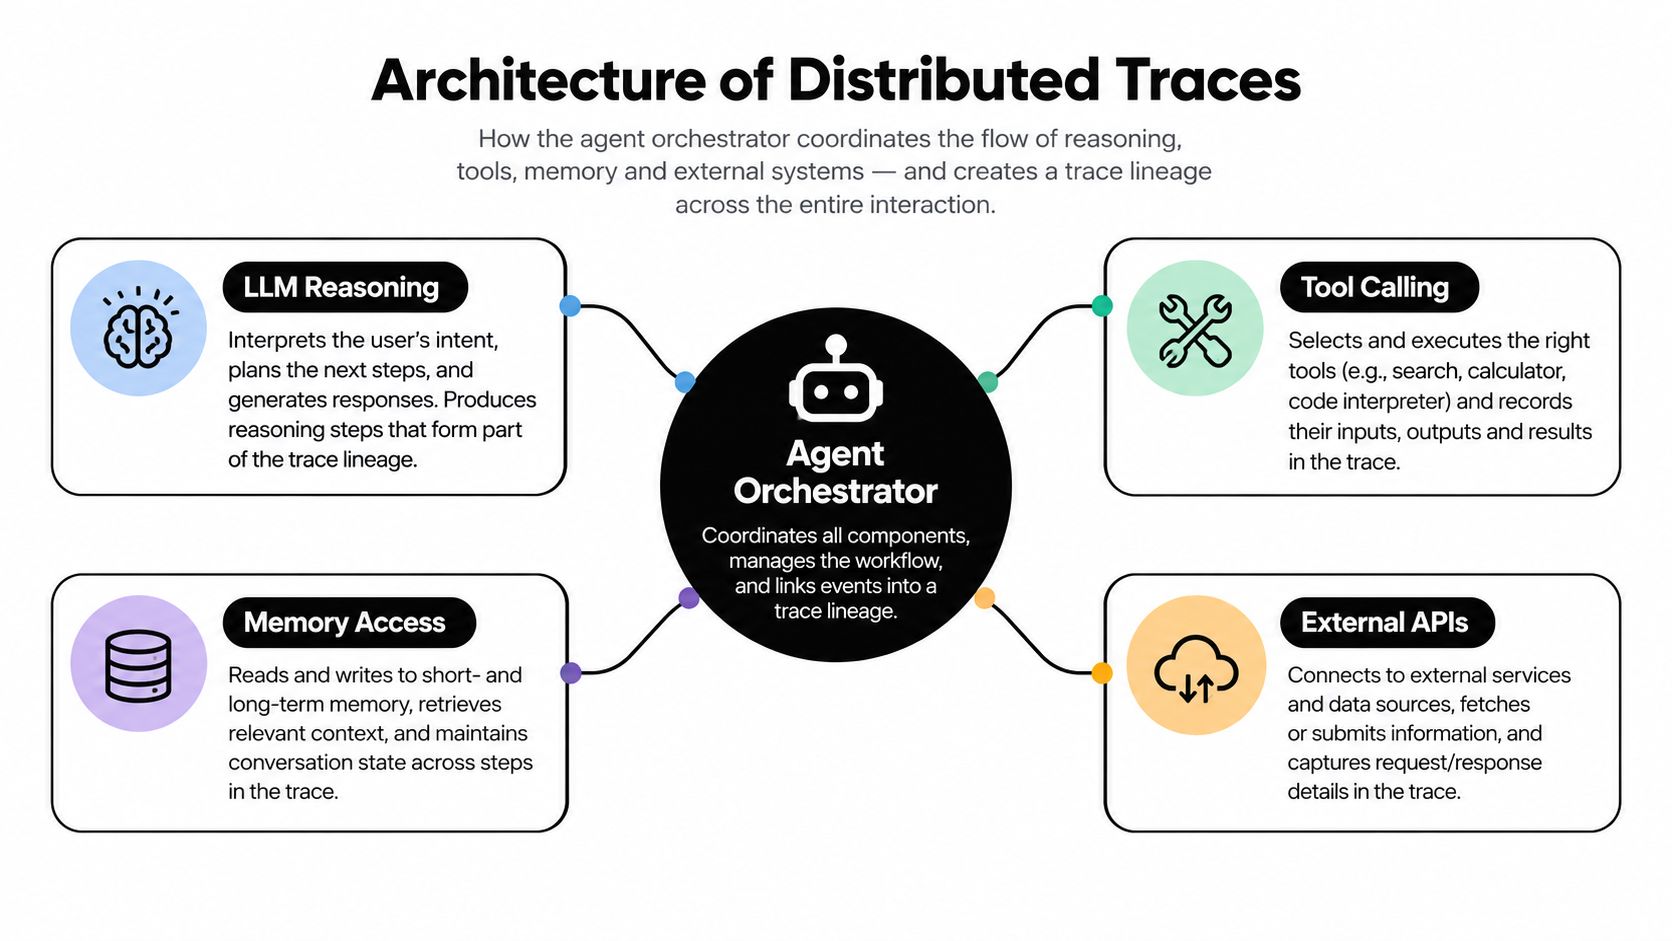
The most useful trace model is a hierarchical span tree. The root span represents the user request or workflow run. Child spans represent planning, retrieval, model generation, tool execution, retries, guardrail checks, and sub-agent handoffs. Each span should carry timestamps, status, inputs and outputs appropriate to its sensitivity level, model metadata, token usage, and a correlation identifier.
Build the trace around execution, not infrastructure
A common mistake is to instrument only the API gateway and the model client. That produces technically valid telemetry, but it leaves the agent's control flow opaque. The root trace should instead follow the logical run across services:
- Request context records the user, tenant, workflow, policy version, and initiating application.
- Orchestrator spans capture planning, loop iterations, stopping conditions, and delegation.
- Model spans record the selected model, prompt version, parameters, token counts, and response status.
- Retrieval spans identify the query, source collection, returned documents, and filtering decisions.
- Tool spans capture the selected tool, validated arguments, authorization result, downstream response, and side effect.
- Recovery spans show timeouts, retries, fallbacks, human approvals, and circuit-breaker decisions.
The trace must cross service boundaries. If a supervisor delegates to a research agent, the child execution should retain the parent trace context. Otherwise, operators get several unrelated records and have to reconstruct causality manually.
This is particularly important for multi-agent architectures and their orchestration patterns. More agents don't automatically produce better reliability. They produce more handoffs, more context boundaries, and more opportunities for a failure to become difficult to localize.
Capture the context that shaped the decision
The model's output is only meaningful alongside the input it received. Store prompt and policy versions, retrieved context identifiers, tool definitions exposed at that step, and relevant memory references. Avoid indiscriminate capture of secrets or personal data. Redaction and field-level access controls should be part of instrumentation, not an afterthought.
A trace should let an engineer distinguish between these failures:
- The model selected the wrong tool.
- The right tool received malformed arguments.
- The tool returned stale or incomplete data.
- A retry repeated a successful side effect.
- A sub-agent received a different policy or context version.
- The final answer ignored a failed intermediate operation.
That level of detail turns an opaque agent run into an inspectable execution graph.
Implementing OpenTelemetry for Agent Telemetry
OpenTelemetry is the practical interoperability layer for agent telemetry. It lets teams emit traces, metrics, and logs through a common instrumentation approach instead of binding every workflow to one vendor's proprietary schema.
The implementation should start with the trace context, not with a dashboard. Create a root span at the boundary where the user request or scheduled workflow enters the system. Propagate that context through the orchestrator, model client, retrieval service, tool adapter, and downstream API.
Use semantic conventions consistently
Independent guidance recommends OpenTelemetry-based instrumentation with GenAI semantic conventions so AI-specific fields remain portable across observability backends. Kestra's overview of agent observability highlights standardized attributes such as gen_ai.system, gen_ai.request.model, and gen_ai.usage.input_tokens, along with the need to connect traces, logs, and metrics through a shared schema.
At minimum, define consistent attributes for:
- Model identity, including the provider, requested model, deployment, and version where available.
- Request data, including operation type, prompt or template version, and generation parameters.
- Usage data, including input and output tokens, cache status, and estimated cost.
- Agent identity, including workflow, role, version, tenant, and execution environment.
- Tool activity, including tool name, argument validation status, authorization result, response status, and side-effect classification.
- Evaluation data, including faithfulness, task completion, policy compliance, and human review outcomes.
Microsoft states that its agent framework emits telemetry according to OpenTelemetry GenAI semantic conventions. AWS OpenSearch documentation also describes standardized AI span attributes. The important engineering decision is to preserve those fields through your own adapters rather than flattening them into unstructured messages.
Instrument at the boundaries
Framework integrations can accelerate adoption, but they don't remove the need for deliberate boundary design. Instrument the code that assembles context, chooses a tool, executes the tool, and commits a state change. A model SDK integration alone won't tell you whether a CRM update was authorized or whether a retry duplicated it.
Keep high-cardinality data usable. Put searchable identifiers in span attributes, place larger payloads in controlled event fields, and redact credentials, personal data, and confidential business content before export. Set retention and access rules by data class. A trace that contains sensitive prompts but lacks access controls creates a new security problem.
OpenTelemetry also gives teams a migration path. You can change exporters or backends without rewriting the agent's control flow, provided the semantic fields and context propagation remain stable.
Production Metrics That Define Agent Health
A healthy agent is not just one with low model latency. It must complete the intended task, use the right tools, stay within cost and policy boundaries, and avoid unsafe state changes. Metrics should therefore combine system performance, agent behavior, and outcome quality.
| Metric Category | Specific Indicators | Primary Use Case |
|---|---|---|
| Latency | p50 and p95 end-to-end latency, step latency, queue time | Detect slow workflows and isolate the responsible span |
| Model usage | Input tokens, output tokens, cache hit rate, cost per user or tier | Control spend and identify prompt or loop inflation |
| Tool reliability | Tool-call frequency, tool failure rate, timeout rate, argument validation failures | Find broken integrations and unsafe tool selection |
| Workflow behavior | Agent success rate, loop iterations, retry count, handoff count | Detect inefficient or unstable execution paths |
| Retrieval quality | Retrieval status, source coverage, context acceptance, citation or grounding checks | Identify failures before generation |
| Evaluation | Step-level faithfulness, reasoning coherence, tool selection accuracy, output quality scores | Track correctness and policy alignment |
| Governance | Approval outcomes, denied actions, identity correlation, external writes | Prove authorization and investigate side effects |
Separate symptoms from causes
End-to-end latency tells you that a user waited too long. It doesn't tell you whether the delay came from retrieval, a slow tool, repeated model calls, or a downstream service. Record both aggregate latency and span-level latency so an alert can lead directly to an investigation path.
Token counts are similarly diagnostic. A rising token total might indicate a larger retrieved context, a prompt regression, an agent loop, or a failed cache. Cost should be attributed to the user, workflow, model, and agent version, not only to the infrastructure account.
Tool-call frequency deserves its own view. An agent that calls a search tool repeatedly may be missing a stopping condition. An agent that stops calling a required validation tool may be producing answers that look complete but lack necessary evidence.
Treat evaluation as an operational signal
Automated evaluation scores belong beside infrastructure metrics. Faithfulness asks whether the response reflects the available evidence. Reasoning coherence examines whether the sequence of steps makes sense. Tool selection accuracy checks whether the agent chose an appropriate capability. Output quality scores can summarize task completion, but they shouldn't replace the underlying trace.
Use human review to calibrate automated judges and convert recurring failures into test cases. A score without a trace is difficult to act on. A trace without an outcome score tells you what happened but not whether the behavior was acceptable.
Dashboard Design and Alerting Thresholds
A useful agent dashboard is organized around decisions, not around every field your telemetry system can emit. The first screen should tell the on-call engineer whether the problem is broad or isolated, whether users are affected, and which execution stage is responsible.
Use three levels of operational detail
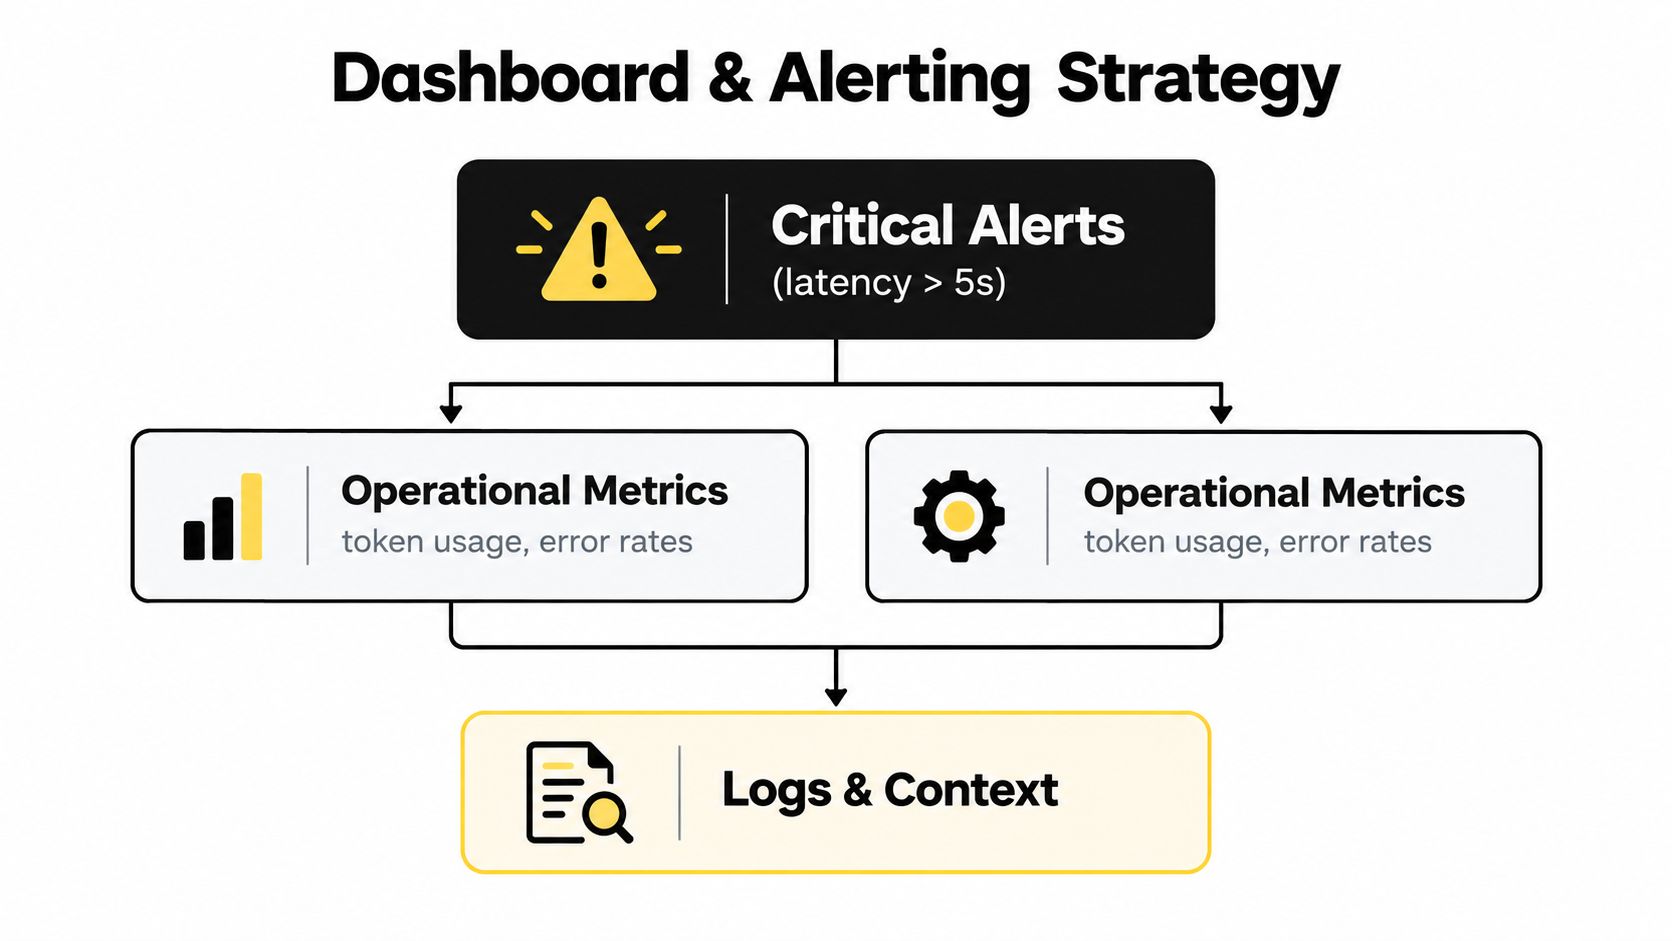
The service view should show request volume, success rate, p50 and p95 latency, token consumption, cost, and evaluation outcomes over time. Break each chart down by agent version, workflow, model, tenant, and tool where those dimensions are operationally meaningful.
The behavior view should expose loop iterations, retries, handoffs, tool failures, denied actions, and unusual changes in tool selection. A sudden increase in tool calls can be more informative than a generic error-rate chart.
The trace view should provide direct drill-down from an alert to representative runs. Include the root request, child spans, prompt and policy versions, tool arguments, downstream responses, and approval records, with sensitive fields protected.
Alert on deviations and consequences
Hard-coded thresholds are useful for immediate safety boundaries, but most operational alerts should compare current behavior with an established baseline for the same workflow. Alert when:
- A critical workflow's p95 latency departs materially from its normal range.
- Token usage rises without a corresponding change in request complexity.
- Tool failures or timeouts cluster around one integration.
- Retries occur after successful or ambiguous writes.
- Evaluation scores fall after a model, prompt, retrieval, or tool change.
- A previously rare tool is suddenly selected at unusual frequency.
- An agent attempts a denied action or operates outside its assigned identity.
Avoid paging on every transient model or network error. Route isolated failures to logs or a lower-severity queue, while paging on sustained degradation, repeated side effects, policy violations, or evidence of uncontrolled autonomy.
Teams building operational dashboards can also review dashboard automation patterns from Cyndra's technical material. The same principle applies here: expose the decision-relevant signal first, then make the underlying trace one click away.
Monitoring Side Effects and Tool Interactions
The most dangerous observability gap appears after the model has finished reasoning. An agent can produce a reasonable explanation while sending the wrong tool arguments, updating the wrong record, retrying a completed transaction, or recovering on its own from a failed write.
OpenLayer's guidance on observability beyond LLM monitoring emphasizes this distinction. Traditional coverage often stops at the model response, while production safety depends on what happened in external systems.

Trace intent and effect separately
For every tool invocation, record both the intended operation and the observed effect. The intent includes the selected tool, arguments, source context, and authorization decision. The effect includes the downstream status, response body classification, records changed, and whether the operation was reversible.
This distinction helps engineers investigate ambiguous outcomes. A timeout doesn't prove that a write failed. If the agent retries without checking idempotency, it may create a duplicate side effect. The trace should show the original request, the timeout, the retry decision, and the final state verification.
Use explicit side-effect classes:
- Read-only, such as search or retrieval.
- Reversible write, such as drafting an update for approval.
- Irreversible or high-impact write, such as sending a message, moving money, deleting data, or changing access.
- External communication, which can create legal, reputational, or customer commitments.
Make recovery visible
Silent recovery paths are often treated as successful execution. They shouldn't be. Record fallback model use, retry reasons, circuit-breaker activation, human escalation, and partial completion. A workflow that completes after a fallback may deserve a different outcome label from one that completes normally.
Require idempotency keys or post-write verification for tools that change state. Keep authorization decisions inside the trace, but separate them from model claims. The model can request an action. A policy engine or service boundary should decide whether that action is permitted.
An agent's final sentence is an output. The records, messages, permissions, and transactions it changed are the incident surface.
Security Gaps and Shadow Agent Visibility
Monitoring covers only the agents an organization knows about and has connected to its telemetry stack. Business teams can create low-code automations, personal assistants, and embedded agents outside the central platform. Those systems may still access customer data, call APIs, and operate with delegated credentials. Their side effects can reach production even when no team owns the resulting trace.
The visibility gap has two sources. Discovery is incomplete when inventory depends on development teams registering their own agents. Identity correlation is weak when logs show an action without identifying the human, service account, workflow, or approval chain behind the authority.
The analysis of AI agent observability and security reports that one in four AI agents may run unmonitored in production. That figure describes a visibility gap, not proof that every unmonitored agent is unsafe. It does show why an approved-agent dashboard cannot serve as the full inventory.
Connect telemetry to authority
Every root trace should answer:
- Which person, application, or workflow initiated the run?
- Which identity did the agent use for each tool?
- Which permissions were available at that moment?
- Which policy allowed or denied the action?
- Did a human approve the operation?
- Which records or systems changed afterward?
An API key or service account is not the agent's identity. One credential may be shared by workflows with different owners, purposes, and risk. Add a logical agent identity, workflow version, tenant, initiating user, and authorization decision to each root trace. Store approval evidence with the run, not only in a separate ticketing system.
Find agents before they become incidents
Discovery should combine code repositories, API gateways, identity-provider activity, SaaS audit logs, workflow platforms, and cloud inventory. See the guide to AI agent security for an inventory model. Search these systems for model endpoints, tool registrations, unusual service-account behavior, and recurring automation patterns. Classify each finding by owner, data access, autonomy, side-effect capability, and monitoring status.
Security teams should inspect orphaned traces too. A tool invocation without a recognized parent workflow, an action from an unapproved agent identity, or a model request that bypasses the standard gateway requires investigation.
The primary risk is unmanaged autonomy combined with incomplete governance. Observability must therefore support access control, asset inventory, and incident response, while exposing what agents change in external systems.
Runbook Snippets for Agent Incident Response
On-call engineers need a short path from alert to evidence. The following runbooks assume that every production run has a root trace and that tool side effects are recorded separately from model output.
Latency spike
- Scope the incident. Compare affected workflows, agent versions, models, tenants, and regions.
- Open representative traces. Break end-to-end latency into queue, retrieval, model, tool, retry, and handoff spans.
- Check execution shape. Look for extra loop iterations, repeated retrieval, slow sub-agents, or a changed stopping condition.
- Contain carefully. Reduce concurrency, disable a degraded tool, route selected traffic to a known-safe fallback, or require human approval for high-impact actions.
- Preserve evidence. Record the first affected deployment, prompt or policy change, and trace identifiers before changing configuration.
Tool failure or duplicate side effect
- Identify the exact tool span. Inspect arguments, authorization, downstream status, timeout behavior, and retry sequence.
- Verify external state. Check whether the operation completed despite an error response.
- Stop repetition. Disable automatic retries for ambiguous writes and apply an idempotency or verification path.
- Assess blast radius. Search traces by tool, workflow, user, record identifier, and time window.
- Escalate the effect. Notify the system owner and affected business team, then document remediation and any required customer or compliance response.
Suspected shadow agent
- Correlate the action. Start with the identity, API call, model endpoint, or changed record.
- Search for a parent trace. If none exists, treat the activity as an instrumentation or governance gap.
- Revoke or narrow access. Preserve evidence before disabling the credential or workflow.
- Find the owner. Use repository, SaaS, identity, and billing records to establish responsibility.
- Register the system. Add ownership, permissions, side-effect classes, telemetry, and approval requirements before restoring operation.
Cyndra helps teams install, train, and manage production AI employees with traceable audit logs covering inputs, tool use, decisions, outputs, and approvals. If you're deploying autonomous workflows and need observability built into the operating model, visit Cyndra to discuss a secure implementation.