 CYNDRA
The popular advice on how to create a KPI dashboard starts too late: pick your metrics, choose some charts, and connect your tools. That's how you get an attractive page that nobody trusts enough to use. Start with the decision, then prove the number before drawing the chart.
A useful dashboard is a set of decision contracts. Each KPI needs a named owner, a meaningful boundary, and an agreed action when performance crosses it. For ecommerce and finance teams, the hard work isn't choosing between a line chart and a bar chart. It's agreeing on what revenue means, reconciling it to the system of record, and deciding who acts when the result misses plan.
Table of Contents
- Choose KPIs Across Four Business Perspectives
- Write a Definition for Every KPI Before Building
- Connect and Reconcile Shopify, Ad, CRM and Finance Data
- Build the Dashboard on a Clean Data Model
- Design Views That Lead to Action
- Automate Refreshes, Secure Access and Review at 30 Days
- Confirm Your First Three KPIs This Week
Choose KPIs Across Four Business Perspectives
Start with the objectives the business must achieve this quarter, not the fields your dashboard tool makes easy to import. An objective such as improving profitable growth needs both a financial result and an explanation of what drives it.
Kaplan and Norton introduced the balanced scorecard in the January–February 1992 issue of Harvard Business Review, connecting financial outcomes with customer, internal-process, and learning-and-growth measures. That distinction still matters: profit tells you what happened; retention, fulfilment quality, and employee capability help explain why.
Use the perspectives to check coverage, not to fill a quota.
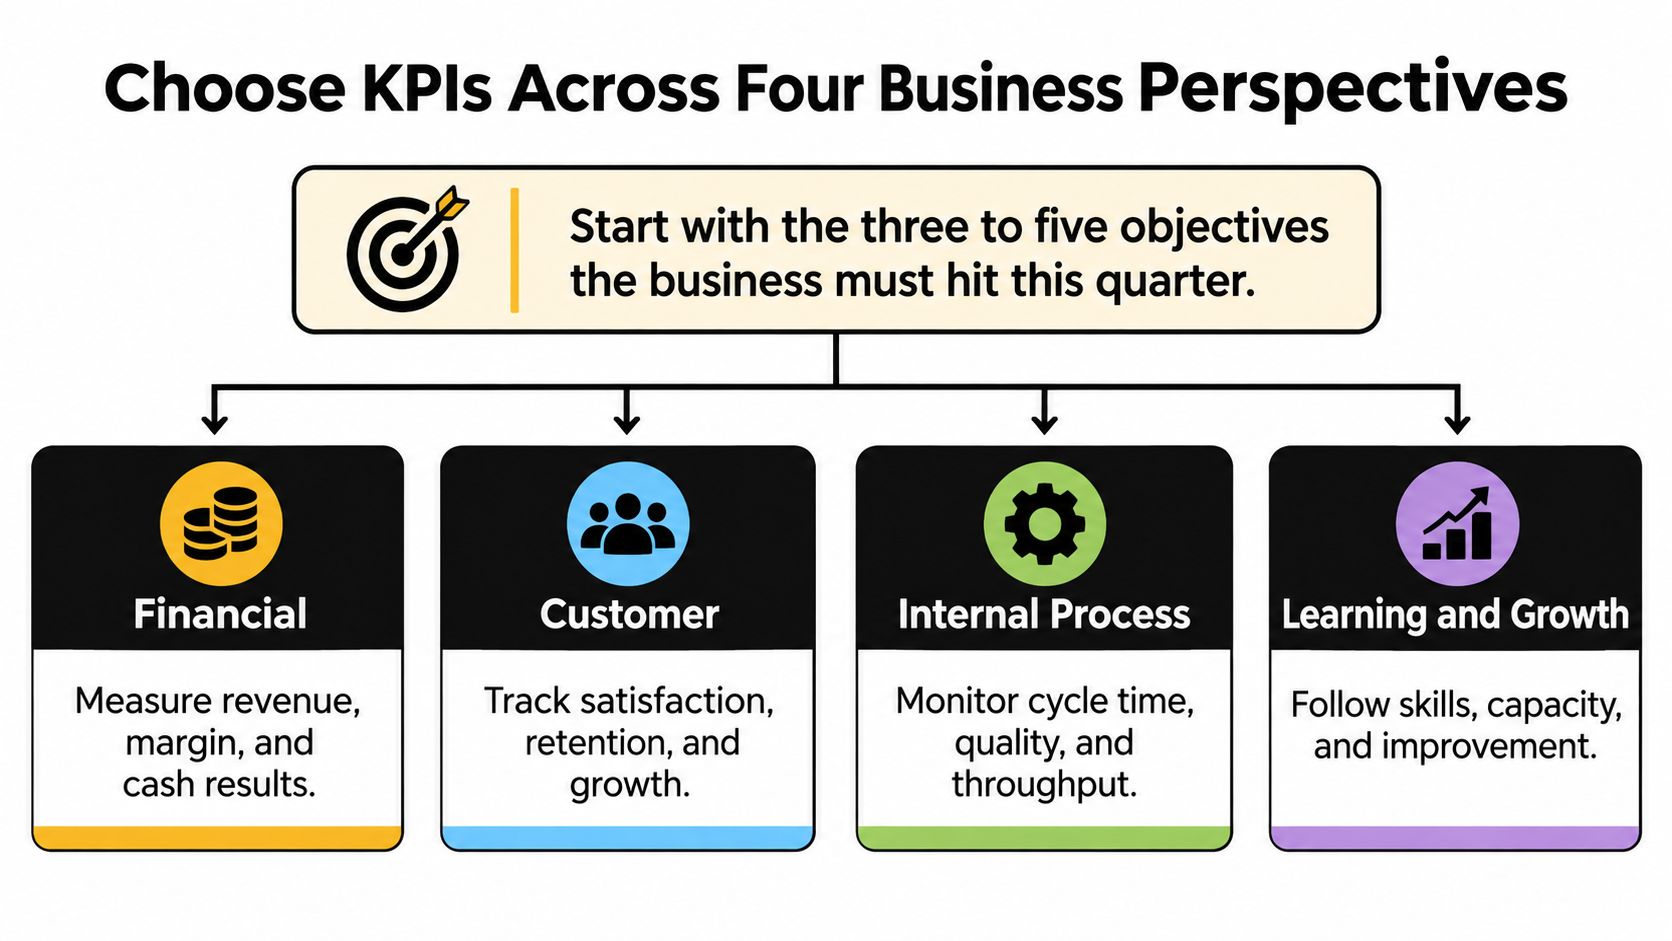
Example KPIs by business perspective
| Perspective | Example KPIs | Typical source | Owner |
|---|---|---|---|
| Financial | Gross margin, cash runway, revenue per rep | Accounting system, Shopify, finance tool | Finance lead |
| Customer | Retention rate, first response time, net promoter score | CRM, helpdesk, survey tool | Head of customer success |
| Internal process | Order fulfilment time, sales cycle length, ticket backlog | Shopify, operations tool, CRM | COO or head of operations |
| Learning and growth | New-hire ramp time, workflow adoption rate, training completion | HR system, workflow logs | People lead |
Financial measures establish whether the business is producing acceptable results. The finance lead might pair gross margin with cash runway, rather than presenting sales growth without its cost.
Customer measures test whether that performance is sustainable. A customer success head can monitor retention alongside first response time, while recognizing that faster replies don't automatically mean better resolutions.
Internal-process measures expose bottlenecks the operations lead can change. Choose from operational efficiency metrics according to the constraint, whether that's delayed fulfilment or an unresolved ticket backlog. For marketplace operations, agentcentral's structured KPI data for Amazon sellers can help organize candidate seller metrics before selection.
Learning and growth measures address future capacity. A people lead tracking new-hire ramp time should define readiness through demonstrated work, not training attendance.
Choose a primary measure for each objective. Add supporting measures only when they explain movement or identify an intervention. Every candidate must answer a named business question; keep rejected candidates in a decision log with the reason they didn't qualify.
Selection rule: If a KPI can't name an objective and an operational driver, it stays off the dashboard.
Write a Definition for Every KPI Before Building
Treat KPI selection as measurement design, not a stakeholder wish list. The implementation approaches described in this Springer article on KPI development combine stakeholder input, operational evidence, importance and measurability scoring, and expert validation.
At Cyndra, our Discovery step maps the client's processes, identifies high-ROI workflows, and scopes the engagement against specific outcomes. Apply that same discipline before opening Power BI, Tableau, or Looker Studio.
Turn candidates into approved contracts
Collect candidates from real workflows. Interview the people requesting the dashboard and inspect raw Shopify, advertising, CRM, and finance exports. A candidate needs an identifiable source, not just a compelling label.
Score importance and measurability. Use a shared scoring scale and agree on the cutoff before reviewing favorites. Reject a strategically weak metric even when it's easy to calculate; investigate instrumentation when an important measure isn't reliable yet.
Validate with process owners. Ask the people processing refunds, updating deals, and closing the books whether the proposed measure represents their work. Managers can approve an objective while missing the exceptions that break its calculation.
Write the metric contract. Record the name, business question, formula, numerator and denominator where applicable, exclusions, owner, source, refresh schedule, target, tolerance band, and breach action. Separate the performance threshold from the data-reconciliation tolerance, because poor performance and incorrect data require different responses.
For example, a proposed net revenue contract could mean paid merchandise value minus refunds, excluding tax and shipping, converted to reporting currency and grouped by paid date. Specify whether later refunds restate the original sales period or appear in the refund period; otherwise, teams can report different totals for the same month while both believe they're correct.
Test a closed period. Calculate the KPI outside the visualization tool and compare it with the designated system of record. Investigate differences at row level before accepting the aggregate.
Document rejections. Record whether a candidate was redundant, unactionable, poorly sourced, or unrelated to the objective. This prevents the same suggestion from returning at every review.
Get release approval. Have the business owner approve the meaning and response playbook, and the data owner approve the calculation and checks. Unresolved disagreements belong in the backlog, not behind a green tile.
Use this definition checklist alongside the approval process.
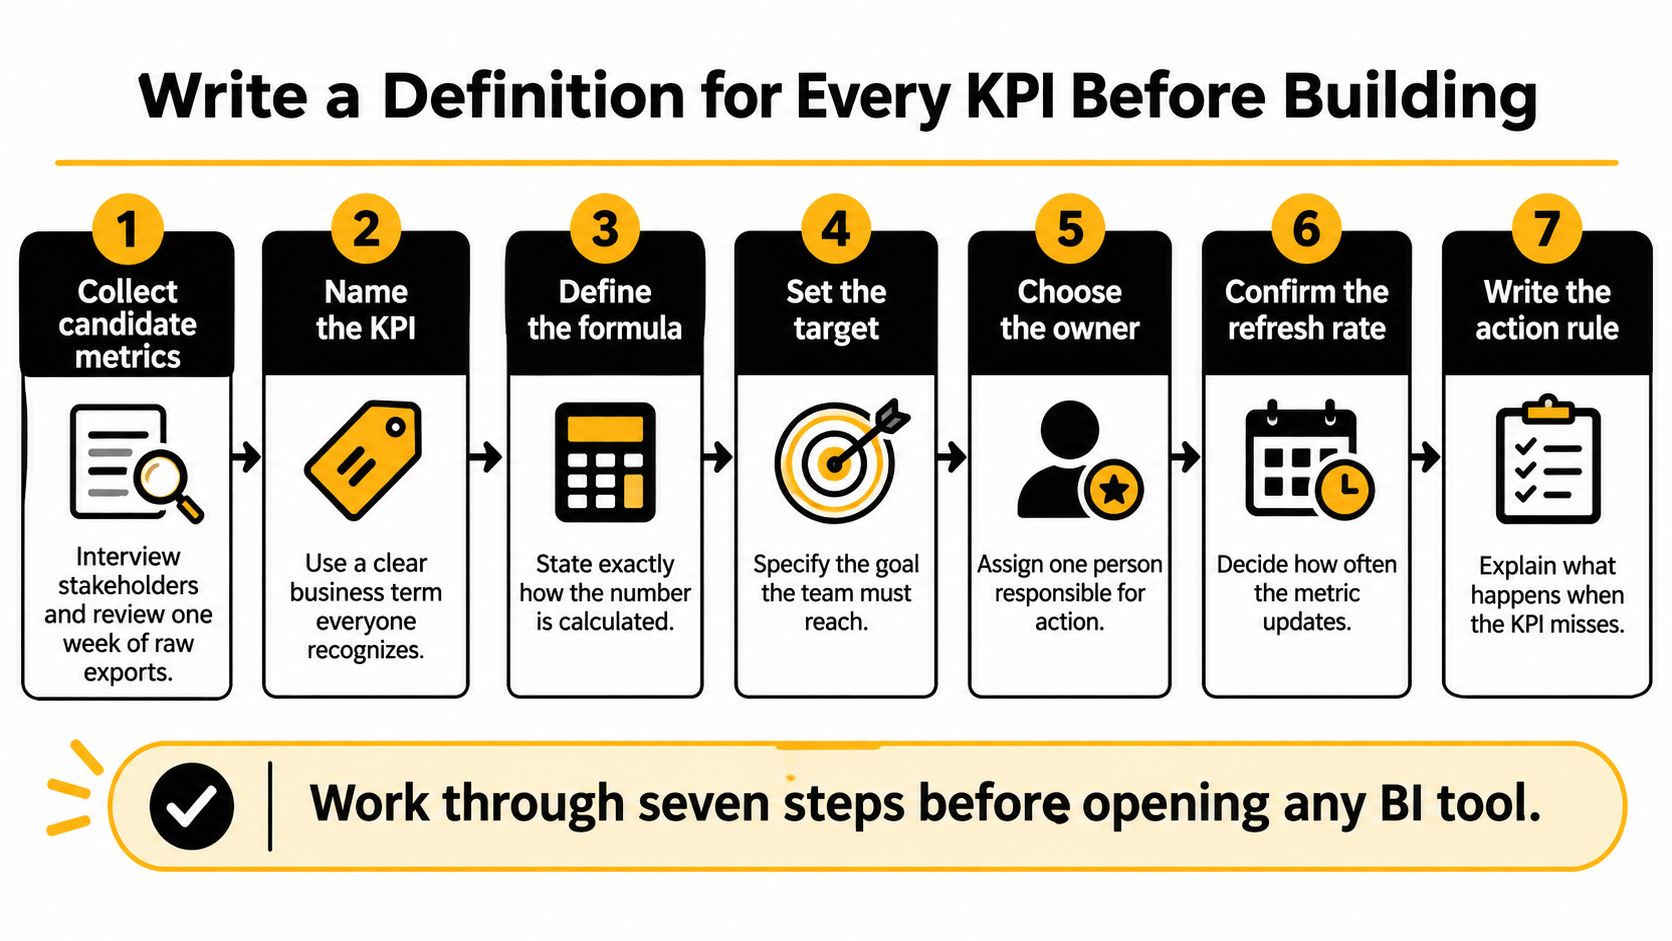
Keep contracts beside the model in version control or a governed metric catalog. Record the effective date of a definition change so users can distinguish a business movement from a calculation change. A KPI is release-ready only when its definition, owner, checks, and decision playbook are approved.
Connect and Reconcile Shopify, Ad, CRM and Finance Data
A dashboard number is only as good as its source mapping. Build a canonical metric layer, a shared set of entities and calculations, before any visual. Connecting an API doesn't establish whether its revenue field means booked sales, captured payments, or recognized revenue.
The BARC BI & Analytics Survey methodology and KPI document provides context for evaluating analytics quality and business value. For implementation, make trust concrete through source ownership, metadata, reconciliation, and visible validation status.
Common cross-system mismatches and fixes
| Source | Common mismatch | Fix before visualizing |
|---|---|---|
| Shopify | Order date and paid date differ; refunds post later; multi-currency totals | Use paid date, net of refunds, in one reporting currency |
| Ad platforms | Each platform credits conversions differently; spend reported in account currency | Set one attribution window and convert spend to reporting currency |
| CRM | Duplicate contacts; deal stages named differently by each team | Merge on customer ID or email; map stages to one shared list |
| Finance tool | Accrual and cash timing differ; invoices dated by issue date | Choose the basis per KPI and label it on the tile |
For Shopify, preserve order, payment, and refund events separately. Apply the approved refund-period policy rather than subtracting every refund from whichever period happens to be open.
For advertising, preserve platform-reported conversions but distinguish them from your normalized attribution view. A common window doesn't eliminate overlapping platform claims, so don't add those claims together and call the result total business revenue.
For CRM data, prefer stable customer identifiers. Use email matching cautiously, retain merge history, and map local deal stages to shared stage definitions before calculating conversion.
For finance, establish whether the KPI uses cash or accrual accounting. Payment receipts and recognized revenue won't necessarily match directly; explain legitimate differences with a reconciliation bridge.
Store event timestamps in UTC and convert them consistently to the reporting time zone. Keep original currency, reporting currency, exchange-rate source, and conversion policy explicit. Similar care applies outside commerce: instructions to connect Robinhood to CoinStats address a connection task, but connection alone shouldn't be treated as proof that a consolidated figure has been validated.
Prove the total and preserve its lineage
For a closed month, compare dashboard paid-order totals with processor receipts and the finance ledger on a comparable basis. Bridge fees, settlement timing, refunds, and accounting adjustments, then investigate any unexplained residual outside the approved tolerance. Don't use a tolerance to conceal a known mapping error.
Every tile should expose lineage back to its source rows and transformation rules. Build that traceability into reporting automation, and label the figure's basis directly on the tile.
A slower, reconciled number is preferable to a live figure nobody can explain. Accept an AI-generated explanation only when it identifies the same metric definition, reporting period, and underlying evidence.
Build the Dashboard on a Clean Data Model
Common build options for a KPI dashboard
| Tool | Best fit | Data connections | Cost model |
|---|---|---|---|
| Looker Studio | Small teams already on Google Sheets or BigQuery | Strong Google connectors; third-party connectors for other sources | Free core; some connectors paid |
| Power BI | Microsoft-based finance and operations teams | Broad, including Excel and Azure sources | Free desktop app; paid licence to share |
| Tableau | Enterprise teams needing fine visual control | Large connector library | Paid licences per creator and viewer |
| Metabase | SQL-comfortable teams wanting self-service questions | Most SQL warehouses and databases | Open source; paid hosted tiers |
Choose the stack your team can maintain. Check current licensing, sharing requirements, and connector availability before committing, particularly when a connector is supplied by a third party rather than the dashboard vendor.
A finance team working in Excel and Azure has different maintenance needs from an ecommerce operator using Sheets. Visual flexibility matters, but an available internal owner matters more than a feature nobody can support.
Establish the grain before joining tables
Use a star schema with fact tables for measurable events and dimensions for descriptive attributes. Orders, advertising spend, and deals should usually have separate fact tables, supported by date, customer, product, channel, and geography dimensions.
Declare each fact table's grain, meaning exactly what a row represents. An order-level fact cannot safely join directly to multiple payment events and multiple order lines without risking duplicated amounts. Aggregate or model those relationships deliberately.
A starter query for net revenue by channel and month is:
SELECT date_trunc('month', paid_at) AS month, channel, SUM(net_amount) AS net_revenue FROM fact_orders JOIN dim_channel USING (channel_id) GROUP BY 1, 2;
This assumes paid_at already follows the reporting-time policy, net_amount implements the approved revenue definition, and dim_channel has a unique matching channel key. If those assumptions aren't true, correct SQL can still produce incorrect business numbers.
Use this build order:
- Connect sources with controlled credentials and retained raw extracts.
- Create facts and dimensions with documented keys and grain.
- Publish metric definitions in a shared semantic layer.
- Build charts against those governed measures.
Don't define gross margin separately in a spreadsheet, a dashboard calculation, and an AI prompt. Store the logic once and let each interface consume it.
For return on ad spend, aggregate attributed revenue and fact_ad_spend to compatible channel and reporting-period grains before joining them. Divide revenue by spend only after confirming reporting currency, attribution policy, and handling for zero spend.
A documented spreadsheet extract can serve as a temporary model for a small pilot. Replace it when manual refreshes, access control, or conflicting copies become operational risks, rather than waiting for a conspicuous failure.
Test the model against the approved reconciled totals. Publish executive and operator views to a shared workspace only after that check passes, with each tile labeled by its accounting or event-date basis.
Design Views That Lead to Action
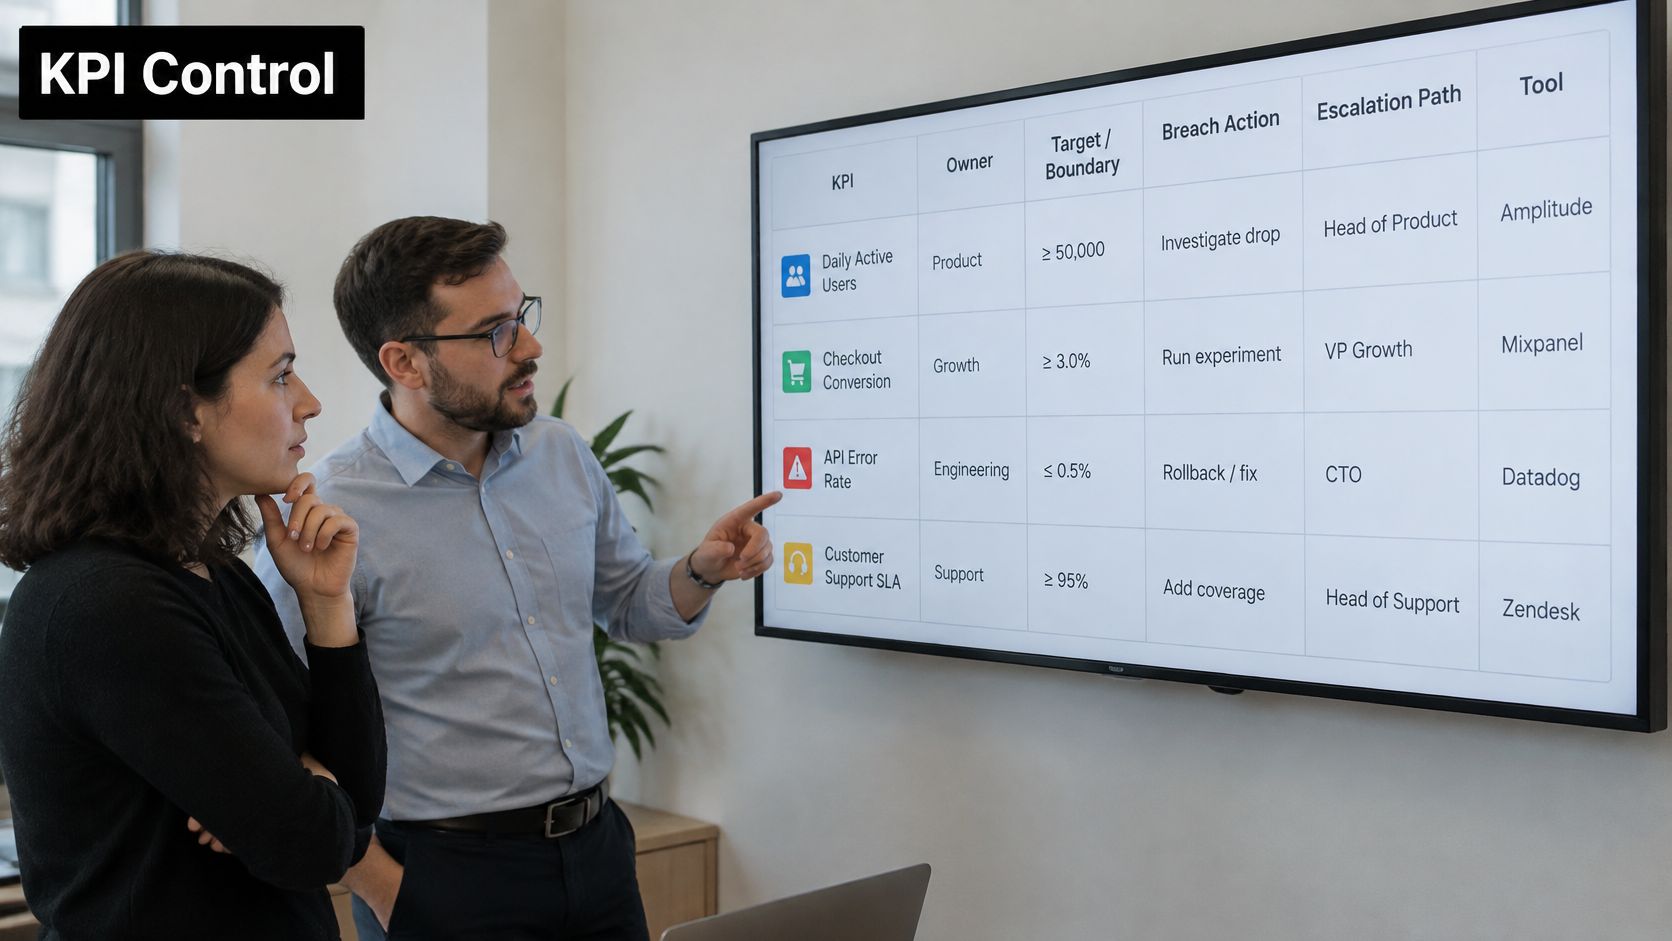
Suppose return on ad spend stays below the campaign's agreed boundary across consecutive refreshes. The paid media lead reviews tracking and conversion lag, pauses weak ad sets where justified, and records the decision in the team tracker. If the breach persists, the growth lead reviews budget allocation.
That's a decision contract in use. A red tile without that response path merely advertises a problem.
Keep the operating discussion visible alongside the numbers.
Give each audience a different working view
The executive view should summarize trend, target, variance, and exceptions on a compact page. Put the business consequence beside the signal, such as margin below plan because fulfilment costs increased. For leadership reporting, Rite NRG's guide to board-ready SaaS metrics offers a useful companion when selecting the measures that belong in a board discussion.
The operator view should expose filters, source-level drill-down, and links to the place where work happens. The paid media lead needs campaign detail and an action destination, not another summary of company revenue.
TechTarget's coverage of growing business-intelligence challenges highlights the move toward embedded insights and AI-assisted decisions. Apply that direction carefully: recommendations should support accountable owners, not silently change spend or customer workflows.
Use these layout rules:
- Give each chart a question. Use lines for trends and bars for comparisons; avoid crowded pie charts.
- Reserve color for status. Pair it with text or symbols so color isn't the only signal.
- Expose the response. Show the owner, breach action, escalation path, and workflow destination.
- Show freshness. Distinguish current observations from stale or provisional figures.
Use the accompanying video as a visual reference while evaluating your own layout.

Test whether users can identify an underperforming channel, explain a revenue variance, and find the responsible owner without coaching. Connect the findings to your data analysis and reporting workflow, rather than treating usability as a cosmetic review.
Remove tiles nobody uses to make a decision, unless they serve an explicit control or oversight requirement.
Automate Refreshes, Secure Access and Review at 30 Days
Refresh timing should follow the decision window, not the connector's fastest available setting. Frequent updates cost effort and can expose incomplete transactions without improving the decision.
The dashboard-delivery framework described in Proficient's dashboard implementation article emphasizes validation, usability, deployment, and monitoring, including a 30-day post-launch review.
Match refreshes to operational needs
- Orders and ad spend need intraday updates when operators can intervene during the trading day. Account for source delays before treating an apparent change as a business event.
- CRM pipeline needs updates aligned with sales management routines. A daily batch can be sufficient when decisions don't require immediate stage changes.
- Finance KPIs should follow the close process. Label results provisional or closed, and keep partial-period operational figures distinct from approved financial reporting.
- Freshness checks should compare source timestamps with the contracted schedule. Flag missed refreshes and stop performance alerts when stale inputs would make them misleading.
Before launch, test freshness, completeness, uniqueness, validity, reconciliation, and latency. Publish a readable quality status beside the KPI, with enough detail to distinguish missing transactions from an unavailable source.
Route alerts to the team's working chat channel with the KPI name, current value, target, owner, and action destination. Test the route with a deliberate test breach, and label the test clearly so it doesn't trigger a real operational change.
Secure the view and review the decisions
Use role-based permissions and row-level security so regional managers see only authorized records. Mask customer personal data, keep connector credentials out of dashboard files, and maintain an audit log for definition changes. Test permissions using ordinary user accounts, not only an administrator login.
During deployment, we run team training, build oversight dashboards, and monitor the first 30 days closely. Internal owners need to know how to investigate a failed refresh and when to suspend an alert, not just how to open the page.
At the scheduled review, measure task completion time, error rate, adoption by role, stale-data incidents, and decisions triggered. Compare those observations with the dashboard's intended job.
High adoption with few decisions deserves investigation. Users may be checking a reporting requirement, struggling with unclear thresholds, or opening a page that contains too many passive metrics. Remove unnecessary tiles before assuming another training session will solve the problem.
Completion test: A dashboard is finished when its owner can explain every number on it and knows what to do when it changes.
Confirm Your First Three KPIs This Week
Start with a small pilot around a shared objective. Keep the scope narrow enough that the team can validate the numbers and practice the response, rather than merely approve a mockup.
A practical working-week plan
- Monday: Score candidate metrics and select a small set that supports the objective. Choose measures whose owners can participate in testing.
- Tuesday: Complete each decision contract. Resolve disputed definitions before anyone starts styling charts.
- Wednesday: Connect the required sources and reconcile a closed period to the finance ledger. Don't proceed while unexplained differences exceed the approved tolerance.
- Thursday: Build executive and operator views with freshness stamps and visible quality status. Ask users to complete realistic tasks without prompting.
- Friday: Test an alert with its named owner, record the resulting action, and schedule the post-launch review before releasing access.
These steps work regardless of the visualization tool. Outside help is most useful when source connections, modeling, or reconciliation would otherwise consume the team's available capacity. Keep business ownership internal even when someone else builds the pipeline.
A small dashboard of trusted KPIs beats a comprehensive page of unverified tiles.
Cyndra offers a free strategy call to map your highest-ROI AI opportunities and give you a clear roadmap, including where reporting work can be automated. Bring a manual reporting task to our free 30-minute live build, and we'll build it with you; you keep the result. Visit Cyndra to turn that task into a practical starting point for a trusted KPI dashboard.